Guide Test Practice 1 - Data about People
1 Understand the Data
1.1 Presenting details that is relevant, appropriate, and accurate
Some answers to this question reveal a common problem with data tasks: drawing the wrong conclusions about what the data tell us. As we saw in lessons 1 and 3, this can present problems for TA score.
To understand the issue, think about where the data in the bar chart has come from. Data about people and how they live generally comes from some sort of survey, where people answer personal questions. Our current data would be based on the answer to one question.
Which of the following questions could have produced the data in the bar chart above?
A. Are you planning to buy or rent a house in the future?
B. Where do you live now?
C. Do you live in a house or a flat?
D. Do you rent or own your home?
E. Would you prefer to own a home or rent?
F. Where did you live before you moved to this house
The only question that fits the data in this charts is Option D: Do you rent or own your home?
This means we do not have any information about where people moved from, or what their living preferences are. Yet some people write sentences like this:
It is clear from the chart that owned accommodation become more popular in the final 4 decades.
To be able to say that something is ‘more popular’, we would need to ask a different question in the survey in the survey. With our current data, we can only say that home ownership was more common in the later years. We do not know if the people concerned preferred or chose to rent - they may have been forced through circumstances (e.g. a lack of money or job). If homelessness was increasing, we would not say that it was becoming ‘more popular’.
Always think about what the data actually tells us - what question does it answer? Avoid using the words popular, favorite, or choice unless the data answers a question such as ‘Which do you prefer / enjoy?’ OR where it is clear that a choice has been made.
1.2 Is there data to support our description?
The data in this chart is from 9 different years, so the same question would need to be asked in each of these years. The first year is 1918 and the last year is 2011, which means this data covers a period of 93 years. Do you think the people who were asked this question in 1918 are the same people answering the question in 2011? I think you’ll agree this is highly unlikely. What about between 1971 and 1991? Again, we do not know. This tells us another important point: the data set for each year can tell us about general trends within the population of England and Wales, but it does not tell us about the movements of individual people. Therefore, we can’t draw conclusions like this:
However, over the next 40 years, more and more residents managed to buy their own place and moved out of rented accommodation.
This is going too far. We don’t know whether the people who said they owned their home in 1991 and moved out of rental accommodation - we do not have data for this. They could be people who have just moved to the area after selling a house somewhere else, they could have lived with their parents until they could afford to buy a house, someone may have given the house to them. The increased numbers of home owners may be due to housing becoming cheaper and easier to buy, government support, or many more homes being built in the area. We do not know, so we cannot make statements about this is our answer.
1.3 How will I know if my statements are relevant?
We need to present clear, logical evidence to support the points we make. The same idea applies in writing task 1. IF we make a statement such as ‘more and more resident moved out of rented accommodation’, then we need to be sure we can supply evidence from the data we are given to support this. If there is no evidence in the data about people moving house, then the statement is not relevant to the task.
Think carefully about what the data actually shows and make sure to only write about what we can prove in the data
1.4 Correlation not causation
It is important to see the data set for each year in the graph as a separate set of people answering the survey question, and we shouldn’t try to connect the data in a cause and effect way. This is an important point in interpreting data, and a fact that is often repeated in academic writing that: correlation (two things matching or occurring at the same time) should not be seen as causation (one thing being directly related to or caused by another)
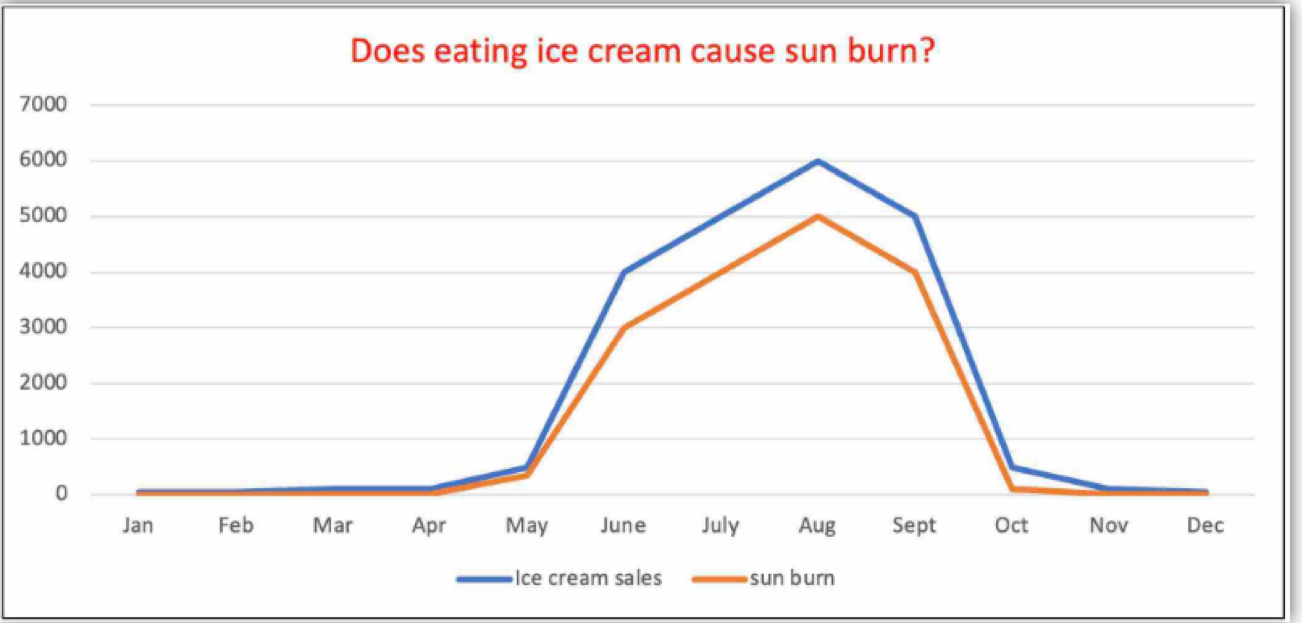
The increases in ice cream sales correspond with increases in sun burn but this is correlation not causation - both just happen to occur in summer or hot weather.
Don’t try to find a connection between the data sets - we will not have enough information for this. We can talk about the data ‘corresponding’, but we should not relate them directly or invent a story about what is happening.
1.5 Language problems in this task
This task presents some language challenges, especially as only 2 variables are mentioned (renting a home or living in a home you own). This means we need to try to avoid repeating the same words and phrases and we need to use different words to those in the question when possible. Remember, we do not need to vary this every time, sometimes a key word is unavoidable. We just need to reduce the number of times we repeat the same terms.
One way to do this is to vary the way we present the data. We can either write about the figures in the chart, or about the people behind the data. Look at the following examples, which all present the same fact:
- The figure for rented accommodation fell from just under 80% in 1918 to less than 70% in 1939.
- The percentage of people renting accommodation fell from just under 80% in 1918 to less than 70% in 1939.
- Fewer people rented accommodation in 1918 than in 1939 (just under 80% and 70% respectively)
Make sure to think about the people behind the statistic, and what the data presents.
Be careful to vary our sentences - don’t always refer just to the figures and what happens to the data. Think about the people that these numbers represent as well.
1.6 Household, House and home
Although this question refers to ‘households’, this does not mean the people all lived in houses - they may have rented or owned a flat. A household refers to the group of people all living together within the same place - whether it is a house or flat. The word ‘home’ covers this nicely as a home refers to the place where we live, whether that is a tent, a boat, a flat, or a house.
1.7 My own, on your own, or to own?
The word ‘own’ often creates problems because of its different meanings and uses. For example, to own is a verb meaning to have something that legally belongs to us; own is also a pronoun, or can be used to mean ‘alone’
The verb ‘to own’ is not used in the same way as the verb ‘to possess’, which has a much stronger meaning and is not appropriate in this context. Another important fact about the verb ‘to own’ is that it is a ‘stative’ verb, this mean it cannot be used in a continuous tense. So, we cannot say, ‘More people were owning their home’. However, we can talk about ‘owning a home’ (the noun form of the verb), and we can also talk about ‘ownership’ and ‘home ownership’ (you will find this written as separate words, hyphenated, or as one word).
Look at the following sentences and decide whether the word ‘own’ is a verb, a pronoun, or means ‘alone’.
- That family is very rich, they live in a huge house and also own 10 properties that they rent out. (verb)
- I didn’t get my project finished because my family arrived and I couldn’t get any time on my own. (alone)
- I still live with my parents, I can’t wait to have my own home. (pronoun)
Consider also that, if we rent a property, someone owns it. The wording in the question and the chart is a little unhelpful here as it refers to ‘owned accommodation’ and ‘rented accommodation’. This works with ‘accommodation’ as the context is clear. But people are often tempted to write ‘living in an owned house / property’, which does not work. We need to write ‘the percentage of people living in their own home’ not ‘living in an owned home’
Sector, market, category
These words are useful umbrella terms to use as synonyms to avoid repetition.
Sector = and area of economic activity (similar to ‘field’ in the academic world). Examples of sector are: the banking sector; the tourism sector; the housing sector
Market = business or trade in a specific product (e.g. the rental market; the housing market)
Category = a group, or system of grouping similar information or things.
If you haven’t already done so, write an answer to this question. Remember the following key steps
1.8 Points to rememer
- Spend a few moments noticing the details in the bar chart. Pay attention to what is being measured as well as when, and how is it being measured.
- Identify the key trends in the data and think about how to write about these in our overview. Remember - we should not mention just one trend.
- Think about: what stayed the same, what changed, what comparisons can be made.
- Group the information together so that we can write about it logically. Chronological order is the clearest and most logical. Remember to make comparisons where relevant.
- Our paragraphs should cover one main idea (e.g. The data for renting) and this should be clear to the reader.
- As we write, remember to vary our tenses and our sentences structures.

write
intro
The chart shows the statistics of owning and renting accommodation of family on England and Wales from 1918 to 2011.
overview
people own home are more and more common from time intersect at 1971
p2 own
p1 rented
have a mild decrease from 1918 to 1953, then drop rapid to 2001 before rose again in 2011
The chart shows the statistics of owning and renting accommodation of families in England and Wales from 1918 to 2011. Overall, people tend to lean more towards having their own properties as renting a house becomes less and less common.
In 1918, owned accommodations were less common, with just over 20% of people. This figure grew rapidly to 50% in 1971 and overtook the proportion of households in rented accommodations. The proportion of family living in their own home continued to rise to the peak of nearly 70% in 2011 before slightly dropping in 2011.
On the other hand, the figure for rented accommodations began the period with a dominant percentage, at nearly 4 times that of owned home in 1918. There was a mild fluctuation in the proportion in the figure of those renting home in 1918 and 1953. The period between 1953 and 2001 experienced a gradual drop in the figure, with just over 30% at the end of the period, before a small rising in 2011.
The chart illustrates the proportion of households in England and Wales that owned or rented accommodation between 1918 and 2011. Overall, the data shows a clear shift from renting to owning, with ownership becoming the dominant trend after the early 1970s.
In 1918, home ownership was relatively uncommon, accounting for just over 20% of households. This figure rose steadily throughout the period, reaching around 50% by 1971, at which point it overtook the share of rented homes. Ownership continued to increase, peaking at nearly 70% in 2001, before experiencing a slight decline in 2011.
By contrast, renting was the predominant form of housing in 1918, at almost four times the level of ownership. The percentage of renters fluctuated mildly between 1918 and 1953 but then fell consistently over the following decades, dropping to just over 30% by 2001. A small rebound occurred in 2011, although renting remained significantly less common than owning.
2 Addressing band 6.5 problems
The chart shows the statistics of owning and renting accommodation of families in England and Wales from 1918 to 2011. Overall, people tend to lean more towards having their own properties as renting a house becomes less and less common.
In 1918, owned accommodations were less common, with just over 20% of people. This figure grew rapidly to 50% in 1971 and overtook the proportion of households in rented accommodations. The proportion of family living in their own home continued to rise to the peak of nearly 70% in 2011 before slightly dropping in 2011.
On the other hand, the figure for rented accommodations began the period with a dominant percentage, at nearly 4 times that of owned home in 1918. There was a mild fluctuation in the proportion in the figure of those renting home in 1918 and 1953. The period between 1953 and 2001 experienced a gradual drop in the figure, with just over 30% at the end of the period, before a small rising in 2011.
2.0.1 Exercises
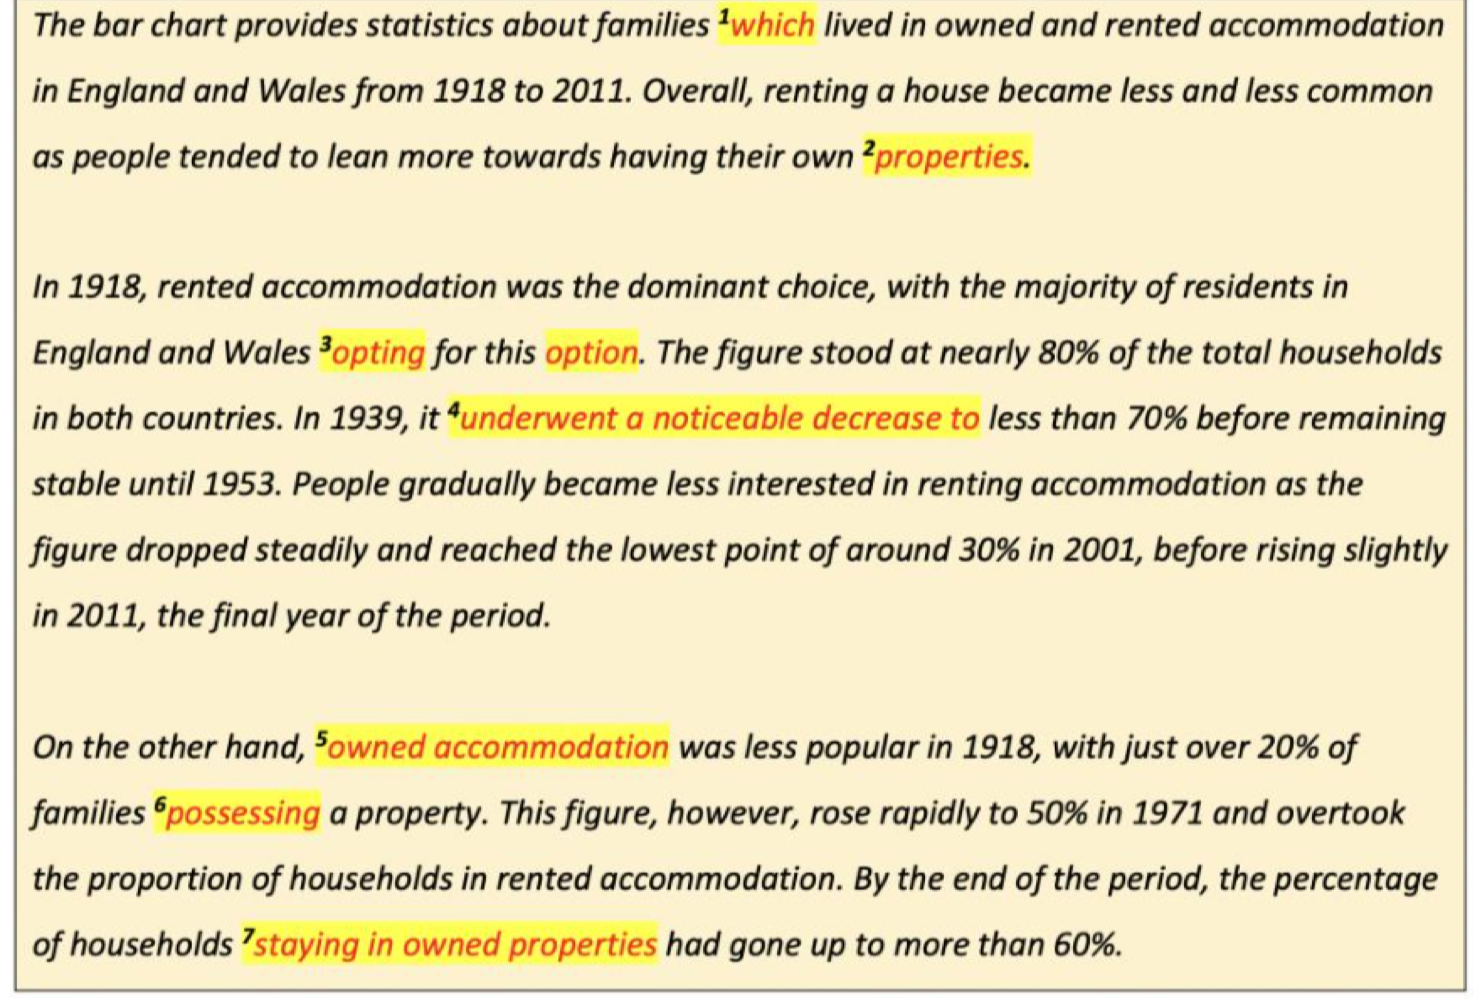
Read through the sample answer. Can you identify any problems?
Can you correct the language issues highlighted
Suggested answers
- Change ‘which’ to ‘who’
- This word should be singular: property
- We generally don’t combine a related verb and noun (e.g. we do not say ‘they are planning a plan’) so we need to change either the verb or the noun: choosing this option / opting for this choice
- We can either say ‘it decreased noticeably’ or ‘it decreased to 70%’, to say both, we need to add another verb (it decreased noticeably, failing to less than 70% …)
- Change to: Home ownership / owning your own home
- ‘Possessing’ is not appropriate here. Change to ‘Owning’
- ‘Staying’ is temporary, this is about people ‘living’ in their own home.
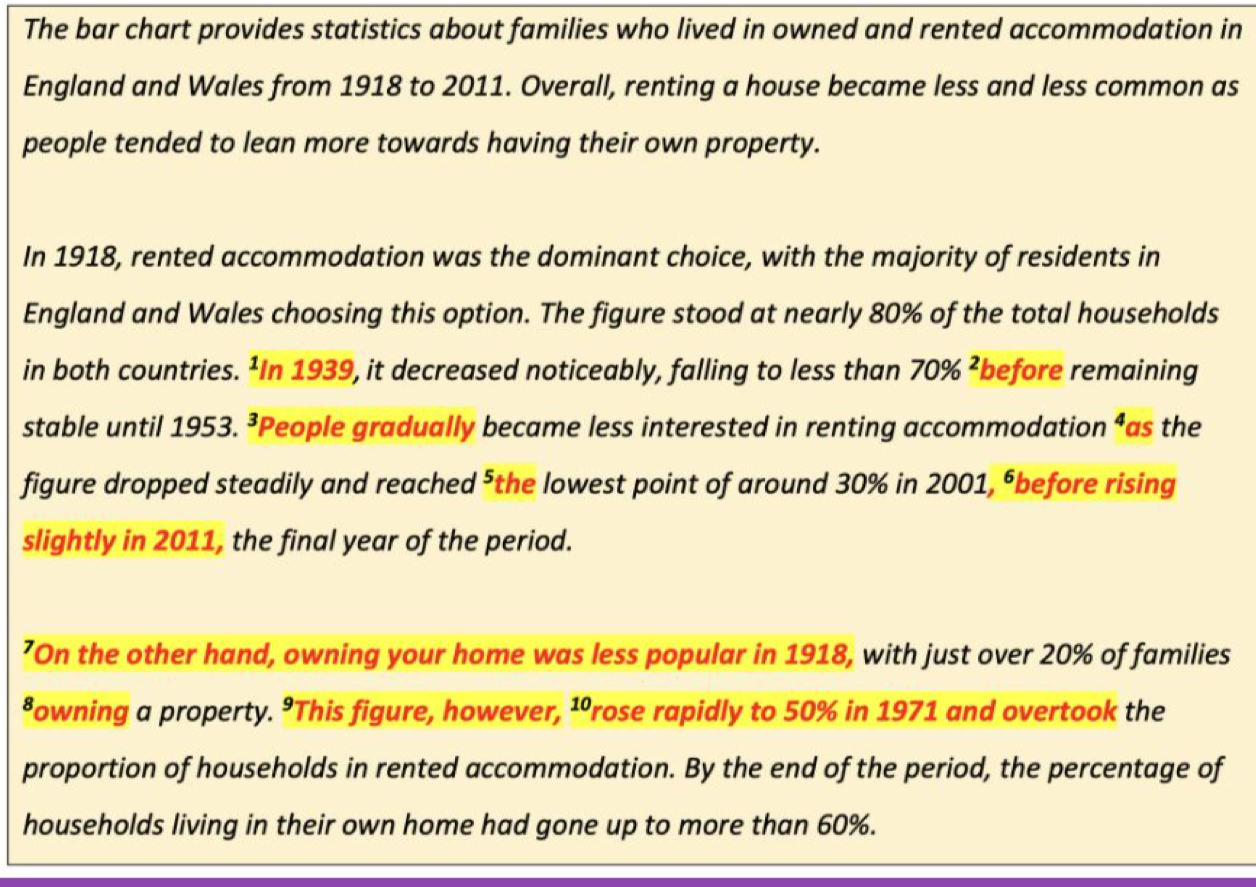
Coherence and Cohesion problem
 Paragraph 1
The fact in this sentence contrasts to the previous one, so this needs to be indicated – (Hint: Start with ’However,…)
‘Before + ing’ is used to say what happened or what was done next and it is odd to use this with ‘remaining stable’ (i.e. nothing happened) ‘then remained’ would be better here.
How does this sentence connect with the previous one? (Hint: It is again introducing a contrasting idea, which needs to be indicated and it is also showing what happened from 1953, which also needs to be signalled). We have already used ‘However,….’ So show this contrast using ‘While….’ (Hint: To do that, you need to change the previous sentence and contrast this idea with remaining stable).
How do we use ‘as’? What is the function of ‘as’ here? (How does it connect the two ideas?) (Hint: Change this to ‘and’. What change could you make to ‘and reached’ to avoid repeating ‘and’ in the sentence?)
We use ‘the’ with the superlative when ranking several things but this is referring to the lowest point for renting, (Hint: use ‘its’)
This whole sentence is very long and this third point is different to the idea that started the sentence (People gradually became less interested in renting…) This means that again we need to show contrast, but it is also better to break this sentence into two. (Hint: Begin the new sentence with ‘It reached…’ and use ‘although’ to avoid repeating ‘however’ and ‘while’. )
Paragraph 2
This sentence should introduce the next topic. Is the main idea of this paragraph that ‘owning your home was less popular’? How can this be made clearer? Remember, you are helping the reader to follow your ideas.
Can you find a way to reduce the repetition of ‘owning’
We can sometimes use ‘however’ like this to add emphasis to the subject (This figure), but this seems odd here. Rewrite this to use ‘However’ correctly.
The word order makes this confusing reorder it so that it is clear exactly what happened in 1971 and add a new cohesive device to show when one figure ‘overtook’ the other.
Suggestion answers:
and answers.
- and 2): Change to: ‘However, in 1939, it decreased noticeably, falling to less than 70%, then remained stable until 1953.’ (NB see next)
3 To introduce a contrast and indicate the time element, we could start with: ‘However, from this point on/ onwards, …’ but we have already used ‘However,’ above, so, we need to change these sentences. For example:
‘’However, in 1939, it decreased noticeably, falling to less than 70%. While it remained relatively stable until 1953, from this point on, ….’’
- ‘As’ can be used to mean ‘at the same time / simultaneously’ (you can see this use in the overview) or to mean ‘because’. Neither meaning is appropriate here - we should not try to explain why something is happening in the data, so we need to change this to ‘and’. To avoid repeating ‘and’ we could change ‘and reached’ to ‘reaching’ :
‘and the figure dropped steadily, reaching its lowest point of…’ (However, we will need to change this - see next sentence).
change to ‘its lowest point’
The sentence needs to be broken up here and, again, we need to show contrast without repeating ‘However,’ or ‘While’. (see the final image below)
Paragraph 2
- It is better to use ‘In contrast’ here. ‘On the other hand’ is used to give a balanced view or perspective and is not appropriate here. The main idea of the paragraph is that owned housing followed a different pattern. So we can say: ‘In contrast, owning a home followed the opposite trend.’ Or, we can just signal a change of subject: ’In terms of owning a home, in 1918…. / Turning to …,
‘
We can change ‘owning a home’ to ‘home ownership’ or change one of these to an active verb: ‘just over 20% of people owned ….’
However, …. (NB, to avoid repeating ‘However’ we could change this to: Nevertheless,)
To make the order of events clear, we need to put the date closest to the relevant verb: ‘However, in 1971, this figure rose rapidly to 50% and from 1981 overtook…’
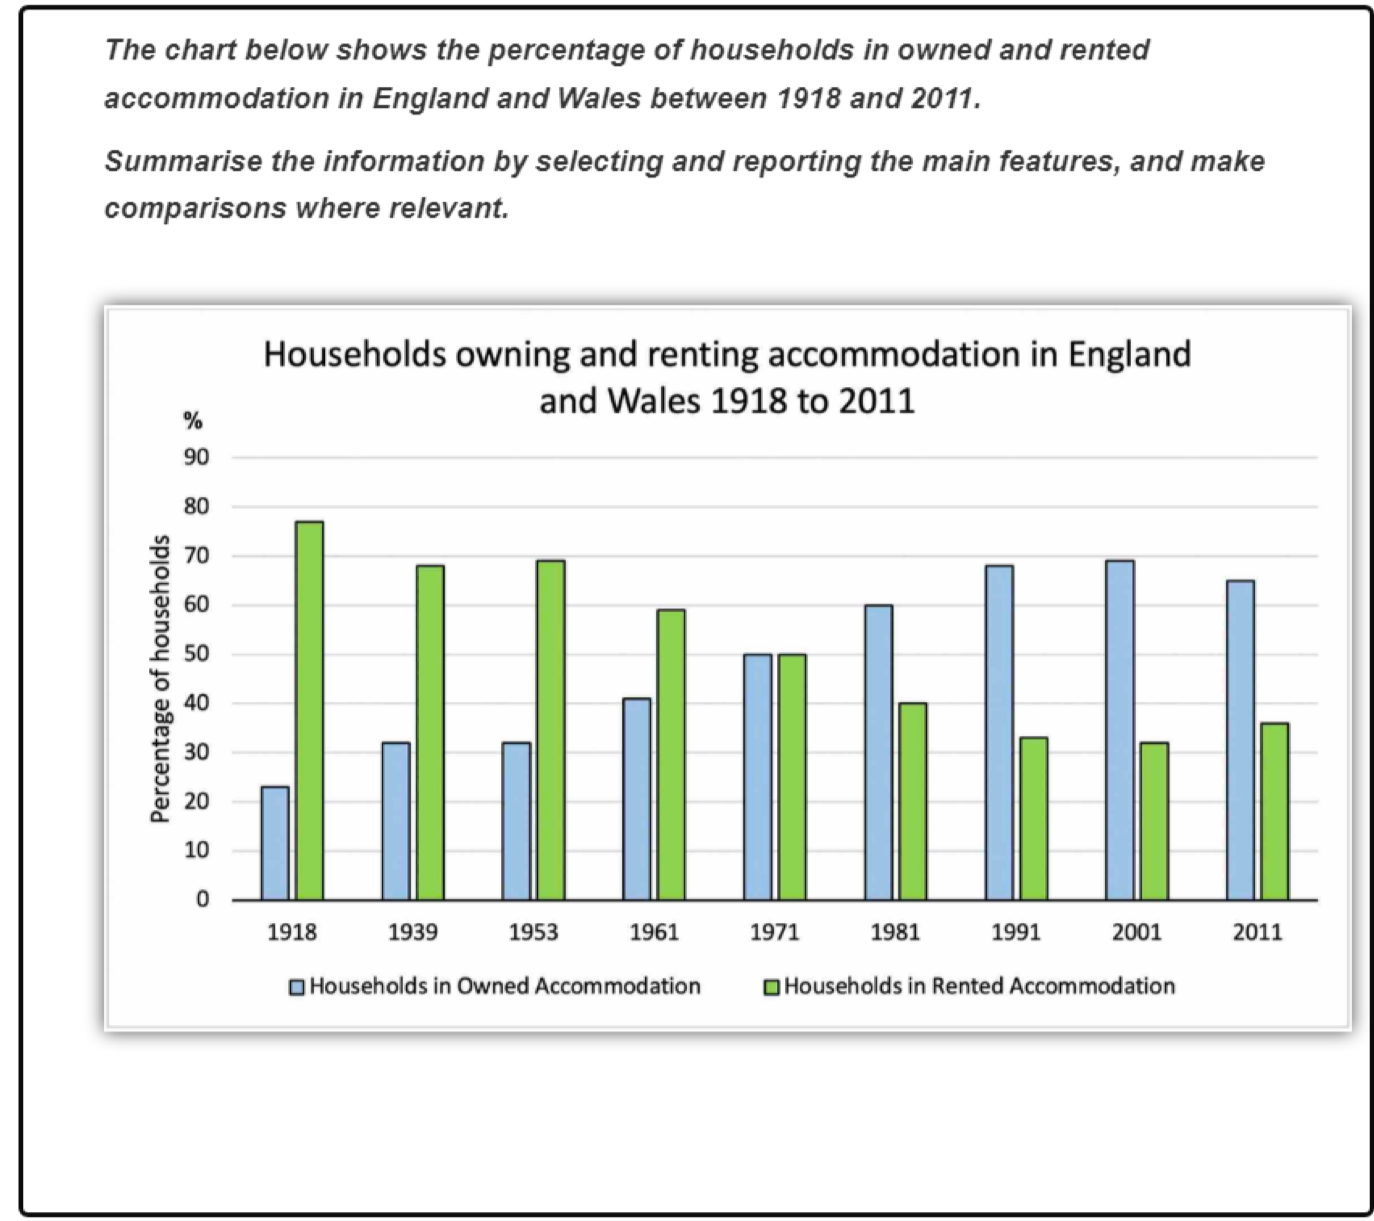
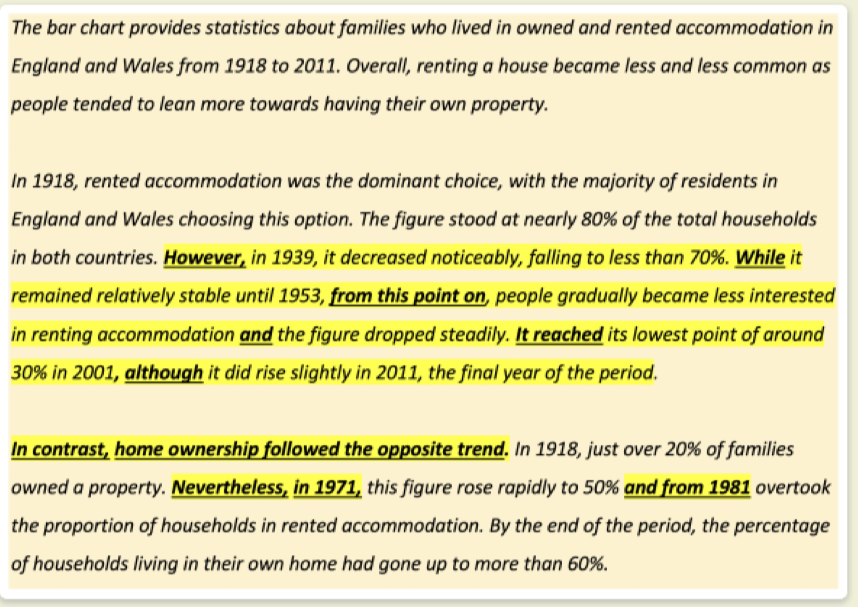
The bar chart provides statistic about families who lived in owned and rented accommodation in England and Wales from 1918 to 2011. Overall, renting a house became less and less common as people tended to lean more towards having their own property.
In 1918, rented accommodation was the dominant choice, with the majority of residents in England and in Wales choosing this option. The figure stood at nearly 80% of the total households in both countries. However, in 1939, it decreased noticeably, falling to less than 70%. While it remained relatively stable until 1953, from this point on, people gradually became less interested in renting accommodation and the figure dropped steadily. It reached its lowest point of around 30% in 2001, although it did rise slightly in 2011, the final year of the period.
In contrast, home ownership followed the opposite trend. In 1918, over 20% of families owned a property. Nevertheless, in 1971, this figure rose rapidly to 50% and from 1981 overtook the proportion of households in rented accommodation. By the end of the period, the percentage of households living in their own home had gone up to more than 60%.
3 Model answer and Language review
The graph compares the percentage of households in England and Wales living either a rental property or their own home in 1918, 1939, and 1963, and at ten-year intervals between 1961 and 2011. Overall, the two sectors followed opposite trends, with renting generally declining as home ownership increased. However, towards the end of the period, there is evidence of this trend reversing and home ownership did not reach renting’s highest level.
Renting was at its peak in 1918, accounting for just under 80% of all households. Despite falling almost continually from this point, it remained the dominant category until 1971, when it reached parity with homeownership. Apart from 1939 and 1953, the figures dropped in almost every decade until 1991, when the decline slowed and renting increased slightly in 2011. Nevertheless, in the final 40 years, significant fewer people (40% or lower) were living in rented accommodation.
This contrasts starkly with the data for home ownership, which climbed steadily throughout, again with the exception of 1939 and 1953. Notably, the increases in owning a home corresponding with the falls in renting, and from 1981 onwards, it was increasingly more common than renting. However, the figure peaked at below 70% in 2001, almost 10% less than the rental peak, and by 2011 had fallen to approximately 65%.