Practice Writing Task 1
Write:
- Step 1: Noticing details
- Step 2: Identifying key information
- Step 3: Grouping information
1
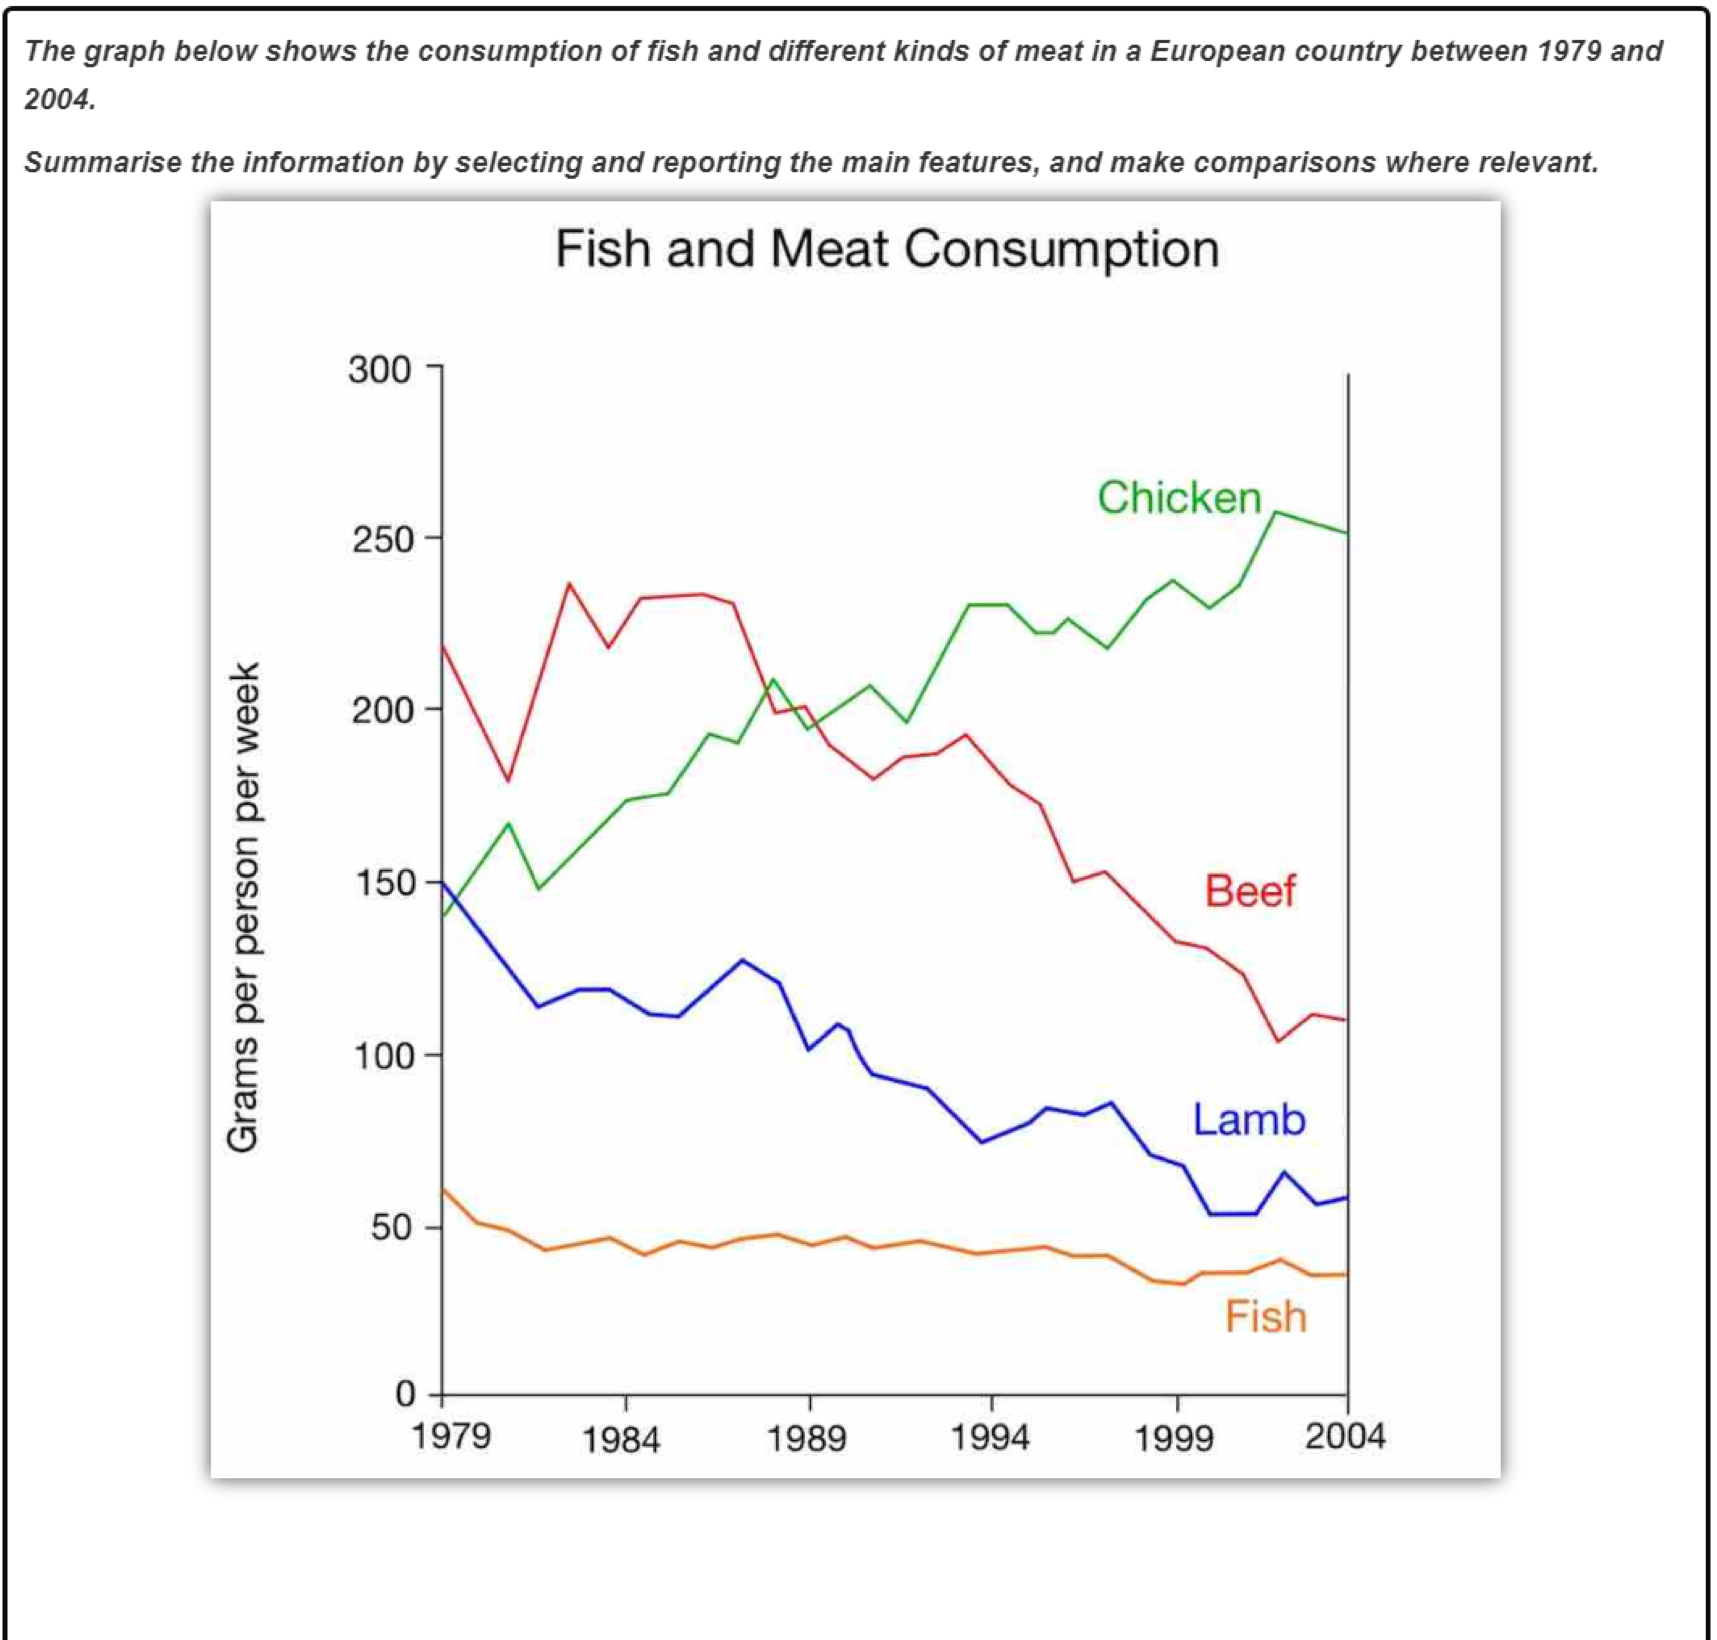
What: fish and meat consumption When: 1979 - 2004, 25-year period (step 5 year) Where: an European country How: grams per person / week (each week, ) Categories: 4 type: fish, lamb, beef, chicken
2 chicken: from below 150 (3) to about 250 (1) +++ overcome beef in 1989 overcome lamb right after 1979
beef: from abow 210 (1) to ~ 120 (2) — fluctuate periods 1982 - 1986, and 1994
lamb: from 150 (2) to ~ 60 (3) – 2 fluctuate time: ~ 1987 and 1998 pattern like beef
fish: above 50 (4) to below 50 (4) - relative stable decrease
3
p1: beef, lamb p2: chicken p3: fish
Write:
The line graph shows the consumption of fish and three types of meat by each person in a European country over a 25-year period from 1979 to 2004.
Overall, it is clear that the minority of food consumption came from fish throughout the period, and the general trend was to move away from beef and lamb as chicken became the dominant meat source of this category.
In the first decade, beef consumption was the highest in the food categories listed. Despite reaching a low of about 150 grams, it then recovered to reach a high of about 230 grams per week. However, after 1988, beef consumption fell almost continuously, and by 2004 had almost 120 grams. Lamb almost exactly mirrored the fluctuation pattern of beef. Falling from the second-highest number at 150 grams in 1979 to approximately 60 grams per week by the end of the period.
In contrast, chicken began the period at below 150 grams in 1979, to took the lead from around 1989 onwards. Especially, the rise in chicken corresponds to the decline of beef and lamb, and by 2002, it hit a peak of about 260 grams before slightly dropping to 250 grams in 2004.
Fish was consistently eaten the least, beginning at around 60 grams per week, then dropping to below 50 grams. While it was the lowest, it remained relatively stable for the majority of the period.
- improve phrasing like:
“to took the lead from around 1989 onwards” -> “and overtook the other meats and fish in consumption from around 1989”
- Avoid vague or incorrect causal links:
“especially, the rise in chicken corresponds …” -> “Notably, the increase in chicken consumption coincided with a decline in both beef and lamb.”
->
Chicken consumption, which started below 150 grams per person per week in 1979, steadily increased and surpassed all other meats by 1989.
Meanwhile, fish remained the least consumed protein throughout the entire period, showing minimal fluctuation.
not: “minority of food consumption came from fish”
->: “Fish accounted for the smallest proportion of consumption.”
not: “hit a peak of about 260 grams”
-> “peaked at approximately 260 grams per person per week.”
Lamb followed a similar declining trajectory to beef, although its figures were consistently lower.
Chicken consumption rose steadily, eventually surpassing all other meat types.
❌ “to took the lead…” (tense and structure error)
❌ “Falling from the second-highest number…” → This is a sentence fragment.
❌ “Especially, the rise in chicken corresponds…” → Misuse of the adverb
Fragments like: “Falling from the second-highest number at 150 grams…” must be restructured:
“Lamb consumption, which started at 150 grams, fell steadily throughout the period.”
Work on tense consistency:
- Past simple or past perfect is preferred for trends over time.
- e.g. “had fallen to”, “peaked at”
0.1 🔹 Improve grammatical precision:
Use fully formed complex clauses (avoid fragments or subjectless reductions).
0.2 🔹 Use more variety in adverbial phrases:
Instead of repeating “approximately,” try:
“just over / just under”
“close to”
“around”
0.4 🔧 Issues:
Some wording is unclear or imprecise:
- ❌ “fish accounted for the smallest number of consumption”
✅ “fish accounted for the smallest share of consumption” or “was the least consumed food type”
- ❌ “fish accounted for the smallest number of consumption”
Small factual mistake: “before decreased to approximately 60 grams in 2005”
❌ “decreased” is grammatically incorrect here.
‘On the contrary’ is misued, it’s used when reversing an earlier statement, not when introducing contrast.
- -> use ‘In contrast’, or “By contrast,” instead
A few abrupt transitions, e.g., between beef and lamb could be smoothed with conjunctions:
🔁 “Lamb followed a similar declining trajectory to beef, although…”
0.5 Problems to Fix:
Collocation errors and awkward phrasing:
❌ “the number of consumption”
✅ “level of consumption” or “amount consumed”❌ “in those category”
✅ “in this category” or “in those categories” (agreement)
Misuse of contractions:
- ❌ “It’s figure began…” → “Its figure began…”
(It’s = it is, which is wrong here)
- ❌ “It’s figure began…” → “Its figure began…”
Grammar errors and missing articles:
❌ “eaten by person”
✅ “eaten by each person” or “per person”❌ “before decreased to…”
✅ “before decreasing to…”❌ “sightly dropped”
✅ “slightly dropped”❌ “50grams”
✅ “50 grams” (spacing error)
Occasional tense or structure mistakes reduce accuracy.
Sample:
The line graph illustrates the weekly per-person consumption of fish and three types of meat in a European country between 1979 and 2004.
Overall, while meat was consumed in significantly greater quantities than fish throughout the period, the general trend shows a decline in beef and lamb consumption and a sharp increase in chicken, which eventually became the most consumed meat.
In 1979, beef consumption was the highest, at over 200 grams per person per week. Although it dropped to around 160 grams early in the period, it recovered to a peak of 230 grams before experiencing a continuous decline after 1988, reaching just over 100 grams by 2004. Lamb followed a similar but less pronounced downward trend, falling steadily from 150 grams to approximately 60 grams.
By contrast, chicken consumption began below 150 grams but rose steadily, overtaking both lamb and beef around 1989. It peaked at 260 grams per person in 2002 before slightly falling to 250 grams in the final year.
Fish consumption remained the lowest throughout the period, starting at around 60 grams and showing only a slight decline to just under 50 grams by 2004.