Writing Task 1 - Migrant workers
The charts provide information about students in 2007 who were happy with different facilities at a university of UK
Question:
The charts provide information about students in 2007 who were happy with different facilities at a university in the UK.
0.1 Step 1: Overview
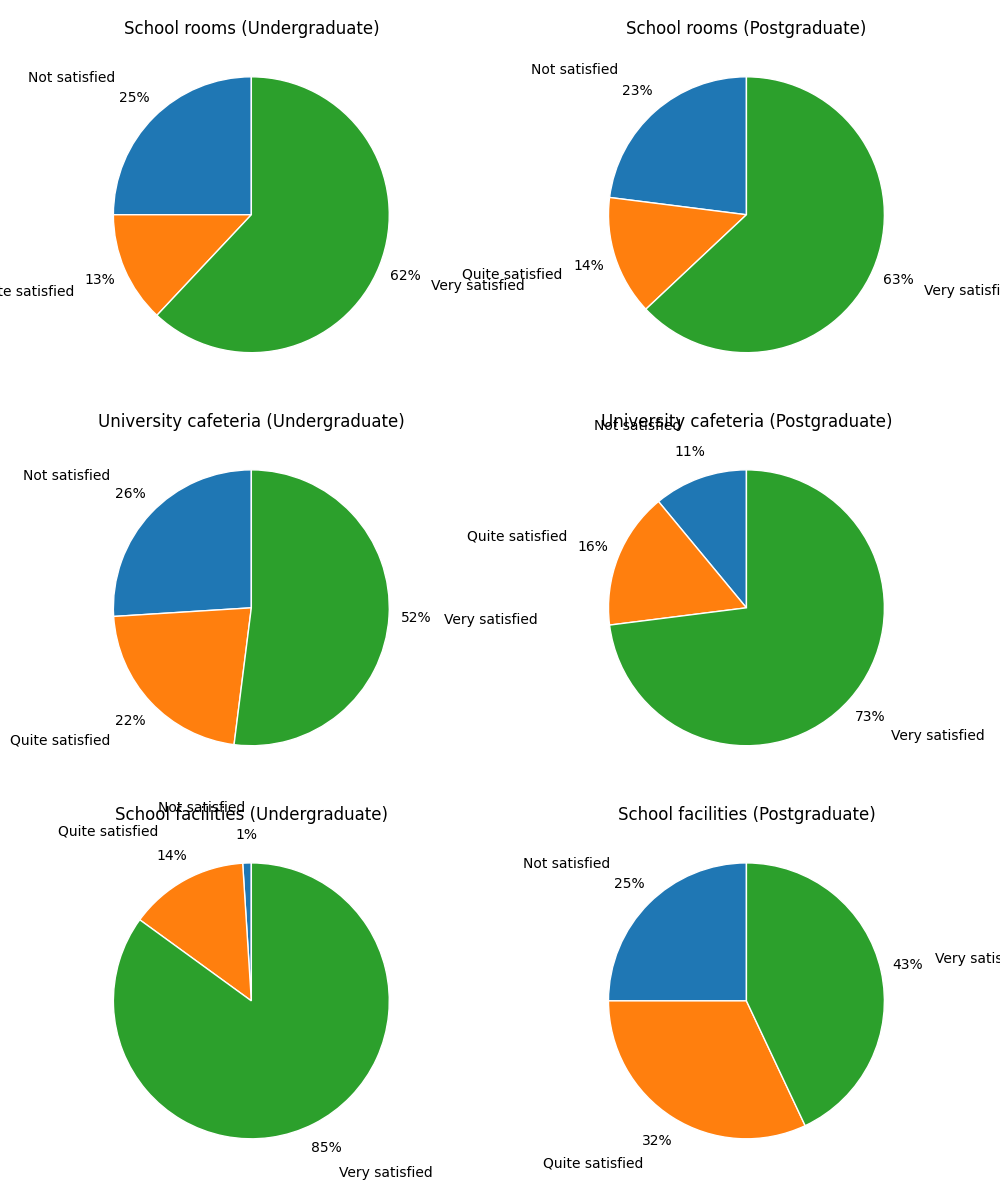
Identify what the charts show: students’ satisfaction (undergraduate and postgraduate) in 2007.
Identify main features:
Postgraduates were generally more satisfied than undergraduates.
The highest satisfaction was with school facilities (85%), and the lowest with cafeterias among undergraduates (52%).
0.2 Step 2: Key Trends (Group the data logically)
School Rooms
Both groups mostly “very satisfied” (62–63%), very similar results.
Fewest students were “quite satisfied” (13–14%).
University Cafeteria
Postgraduates much happier (73%) than undergraduates (52%).
Undergraduates had higher “not satisfied” (26%).
School Facilities
Undergraduates extremely satisfied (85%) — highest across all charts.
Postgraduates more mixed (43% very satisfied, 32% quite satisfied).
0.3 Step 3: Structure the Essay
Paragraph 1 – Introduction
Paraphrase the question.
The charts compare the levels of satisfaction among undergraduate and postgraduate students at a UK university in 2007 regarding three types of facilities.
Paragraph 2 – Overview
Give overall trends without numbers.
Overall, postgraduates were generally more satisfied than undergraduates. The school facilities received the most positive feedback, while the cafeteria was rated least favorably by undergraduates.
Paragraph 3 – Details (School rooms + Cafeteria)
- Describe percentages clearly and make comparisons.
Paragraph 4 – Details (School facilities)
- Highlight contrast between groups and emphasize extremes.