Practice Writing Task 1
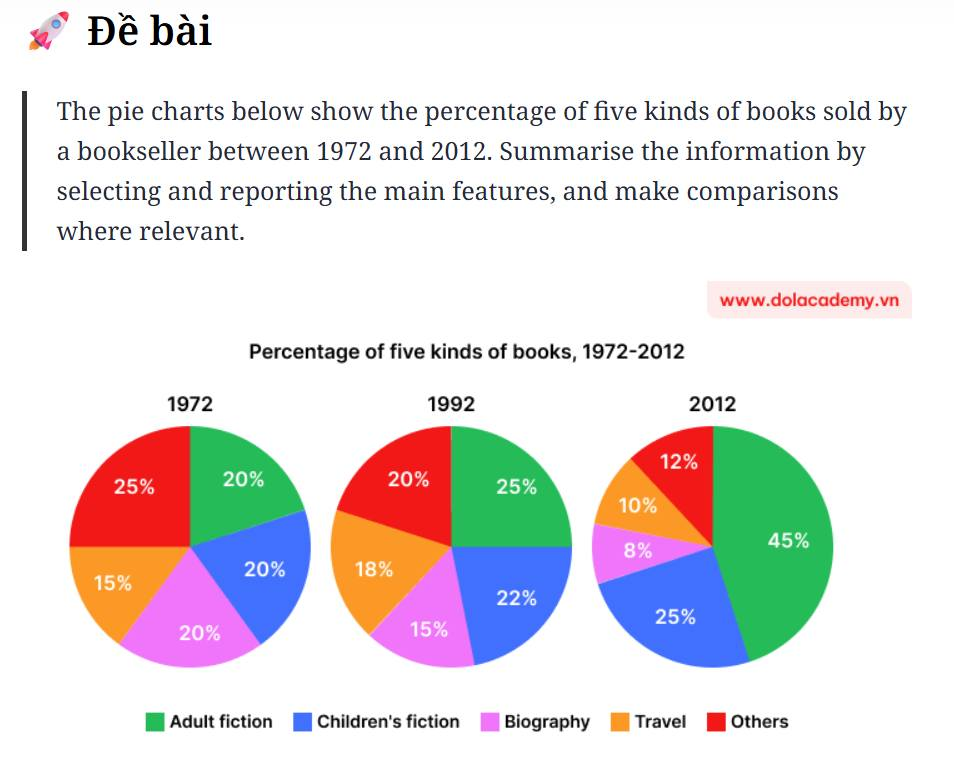
The three pie charts compare the proportions of five categories of books sold by a bookseller in 1972, 1992, and 2012.
Overall, adult fiction rose dramatically to dominate sales by the end of the period, whereas biography and the residual “others” category both contracted sharply. Children’s titles edged up slightly, while travel books first gained ground and then fell back.
In 1972, sales were fairly balanced: adult fiction, children’s fiction and biography each accounted for 20%, with travel on 15% and others the single largest segment at 25%. By 1992, adult fiction had become the clear leader at 25%, children’s books stood at 22%, and travel rose to 18%. In contrast, biography slipped to 15%, and others declined to 20%.
The most pronounced change occurred over the following two decades. Adult fiction more than doubled its share, surging to 45% in 2012. Children’s fiction continued a modest upward trajectory to 25%, placing it second. By comparison, travel’s slice nearly halved to 10%, biography fell even more steeply to 8%, and others shrank to 12%. Consequently, by 2012, the market had become far less even, with adult fiction alone representing almost half of all books sold.