Carbon dioxide
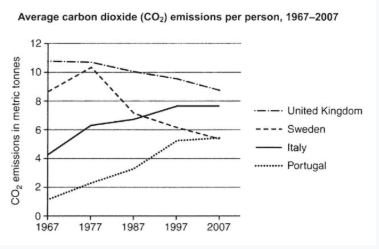
The graph below shows the average carbon dioxide (CO2) emissions per person in the United Kingdom, Sweden, Italy and Portugal between 1967 and 2007.
Summarise the information by selecting and reporting the main features, and make comparisons where relevant.
- Step 1: Noticing details
- Step 2: Identifying key information
- Step 3: Grouping information
1
time range 1967 to 2007 (40 years)
unit CO2 emissions per person (in metric tonnes)
countries: UK, Sweden, Italy, Portugal
type of trends
UK highest, gradual decrease
Sweden decline after peak
Italy & Portugal steady increase
Crossover
Italy passed Sweden around 1987
Portugal caught up with Sweden by 2007
2
UK started highest and gradually declined
Sweden declined sharply after 1977
Italy and Portugal both increased, with Italy rising steadily and Portugal starting low but increasing the most proportionally
in 2007, all four countries were similar (around 5-8 tonnes)
A clear convergence over time - large gap in 1967, smaller gap in 2007.
3 p1 introduction p2 overview p3 UK and Sweden (declining countries) p4 Italy and Portugal (rising countries)
1 Sample
1.1 Introduction
The line graph illustrates the average carbon dioxide (CO2) emissions per person in four European countries - the United Kingdom, Sweden, Italy, and Portugal - over a 40-year period from 1967 to 2007.
1.2 Overview
Overall, while the UK and Sweden experienced significant declines in per capita emissions, Italy and Portugal saw upward trends. By the end of the period, the emissions levels of all four countries became more closely aligned, despite their very different starting points.
1.3 Paragraph 1: UK and Sweden
In 1967, the United Kingdom had by far the highest CO2 emissions, at approximately 11 metric tonnes per person. However, this figure steadily declined over the 40-year period, reaching just over 8 tonnes in 2007. Sweden followed a similar pattern: emissions rose slightly from 9 to a peak of about 10 tonnes in 1997, before dropping sharply to just over 5 tonnes by the end of the period.
1.4 Paragraph 2: Italy and Portugal
In contrast, both Italy and Portugal showed rising trends. Italy’s emissions increased gradually from about 4 tonnes in 1967 to around 7.5 tonnes in 2007, overtaking Sweden in the late 1980s. Portugal, which began with the lowest emissions at roughly 1 tonne per person, saw a consistent rise throughout the period, reaching levels similar to Sweden by 2007.
Conversely, both Italy and Portugal experienced upward trends in carbon emissions over the period. Italy’s figures rose steadily from approximately 4 metric tonnes in 1967 to nearly 7.5 tonnes by 2007, surpassing Sweden sometime in the late 1980s. Meanwhile, Portugal, which started with the lowest per capita emissions at around 1 tonne, recorded a continual increase and reached a level comparable to that of Sweden by the end of the timeframe.