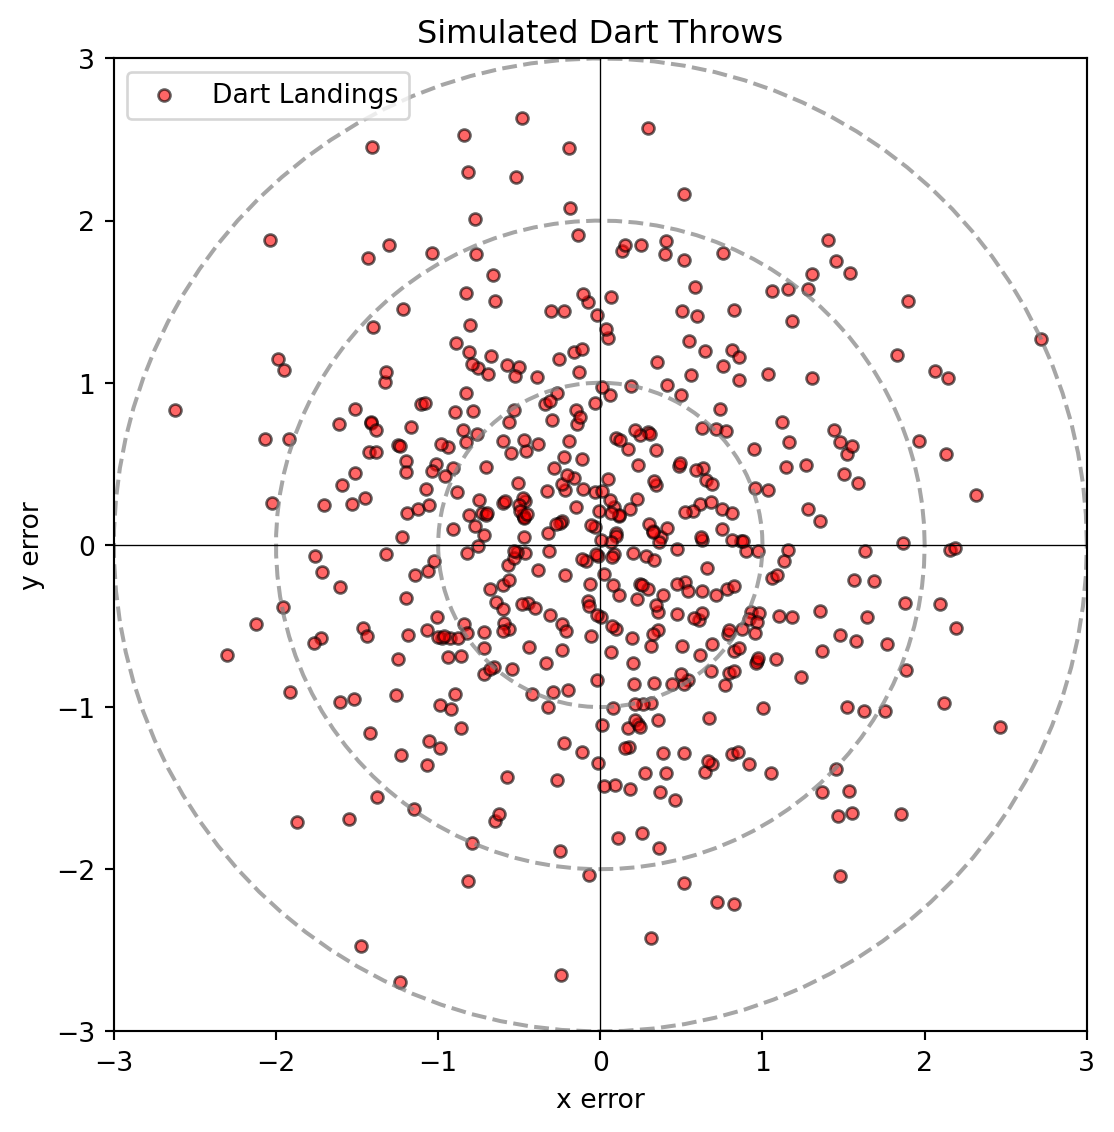
import numpy as npimport matplotlib.pyplot as plt# Set random seed for consistent simulated coordinatesnp.random.seed(42)# Bivariate standard normal distribution parameter (spread scale sigma = 1)sigma =1.0# Simulate 500 random dart throws based on independent normal errorsnum_darts =500dart_x = np.random.normal(0, sigma, num_darts)dart_y = np.random.normal(0, sigma, num_darts)# Set up a single plot layoutfig, ax1 = plt.subplots(figsize=(6, 6))# Plot: Simulated Dart Throwsax1.scatter(dart_x, dart_y, color='red', alpha=0.6, edgecolors='k', s=20, label='Dart Landings')# Draw concentric rings representing equal distance (r) from the centerangles = np.linspace(0, 2* np.pi, 100)for r in [1, 2, 3]: ax1.plot(r * np.cos(angles), r * np.sin(angles), linestyle='--', color='gray', alpha=0.7)# Center crosshairsax1.axhline(0, color='black', linewidth=0.5)ax1.axvline(0, color='black', linewidth=0.5)# Axis configurationax1.set_xlim(-3, 3)ax1.set_ylim(-3, 3)ax1.set_aspect('equal')ax1.set_title('Simulated Dart Throws')ax1.set_xlabel('x error')ax1.set_ylabel('y error')ax1.legend()plt.tight_layout()plt.savefig('dartboard_visualization_single.png')